
Graph: Popular music is getting more energetic over time
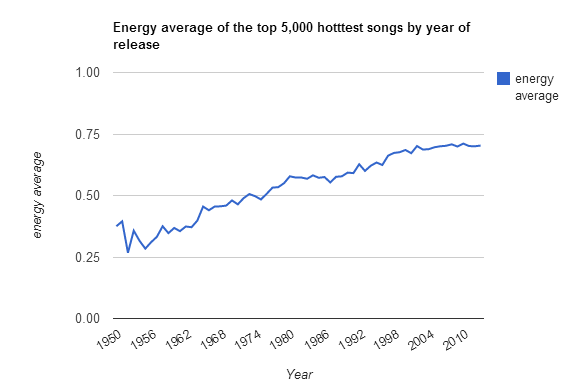
The music geniuses over at The Echo Nest looked at the 5,000 most popular songs from each year since 1950 and determined that the energy level of our music has been increasing greatly. The greatest leap was during a little decade known as the 1980’s. From Echo Nest:
The Echo Nest’s “energy” attribute, which is available for every song in our database, is computed by a combined analysis of many parts of the musical signal — the loudness, beats, structural changes and sounds of the instruments. This “energy” attribute results in a scaled floating point metric from 0 to 1, where 1 is the most energetic. From this analysis, popular music’s energy level started out around .3, and has now climbed to .7 — a big increase, and one that took decades.
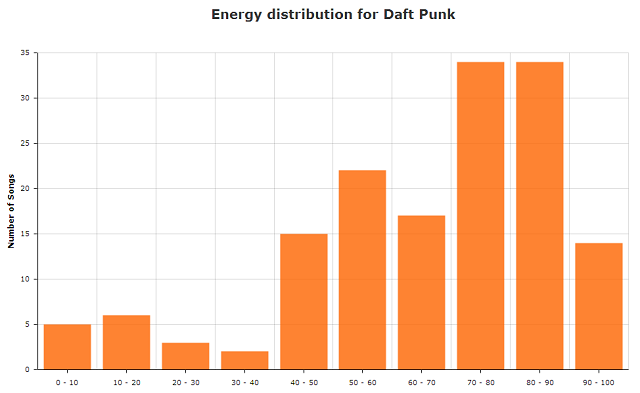
You can even use their handy ArtistX app to see how energetic your favorite artists are. Here’s Daft Punk for example:
-
 Last Row is a weekly music podcast for the fans in the back, with no prior music bona fides required for entry. From up-and-coming artists and new songs to good music videos and bad live shows, we'll be talking about it all from our vantage point in, where else, the last row.
 -


Follow us on Facebook: